


Creating and using pivot tables in Google Sheets involves selecting your data range and navigating to the "Data" menu to choose "Pivot table." Once the pivot table is set up, you can customize rows, columns, values, and filters to analyze your data effectively. By dragging and dropping fields into the appropriate areas, you can summarize large datasets, identify trends, and gain insights. This powerful tool enhances data analysis, making it easier to interpret and present information clearly.

Creating a template in Google Docs involves starting with a new document and customizing it to suit your needs. Design your layout by adjusting fonts, colors, and spacing, and add any specific sections or placeholders that you want to reuse. Once your document is ready, navigate to the "File" menu and select "Make a copy" to preserve the original. You can also save it as a template in Google Drive for easy access, allowing you to streamline future projects with consistent formatting.

To pull data from another sheet in Excel, begin by selecting the cell where you want the data to appear. Type an equal sign followed by the name of the source sheet and an exclamation point, then reference the specific cell or range you wish to extract. For example, entering =Sheet2!A1 will pull the value from cell A1 on Sheet2. You can also use functions like VLOOKUP or INDEX-MATCH for more complex data retrieval. Ensure that sheet names are correctly referenced, especially if they contain spaces.
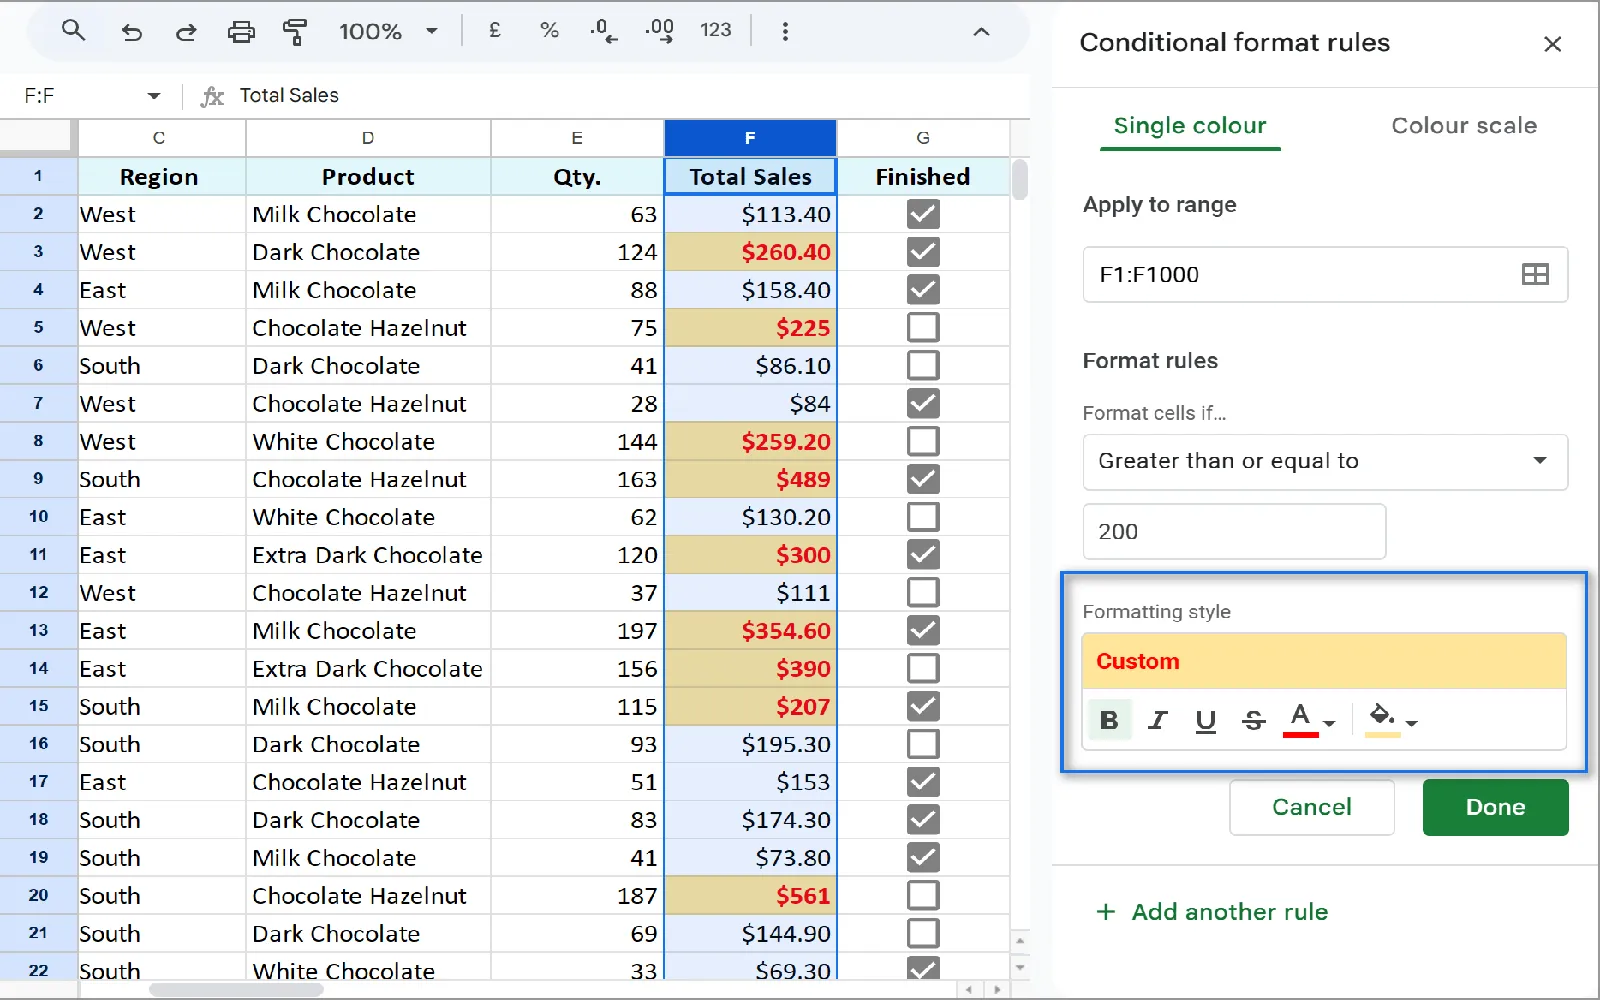
Conditional formatting in Google Sheets allows users to apply specific formatting styles to cells based on their content or conditions. To use it, select the desired range of cells and navigate to the "Format" menu, then choose "Conditional formatting." In the sidebar, you can set rules based on criteria such as text, numbers, or dates. Once the condition is defined, you can customize the formatting options, such as text color, background color, or boldness, to visually highlight important data.
This beginner's guide to Excel introduces users to the essential features and functionalities of the software. It covers navigating the interface, entering and formatting data, and utilizing basic formulas for calculations. Users will learn how to create and customize spreadsheets, manage data using sorting and filtering, and visualize information through charts and graphs. With step-by-step instructions and practical tips, this guide empowers newcomers to confidently use Excel for personal and professional tasks, enhancing their productivity and data management skills.

To create recurring tasks in Trello, utilize the Butler automation feature, which allows you to set up rules for automatic task creation. Start by selecting a board and accessing the Butler menu. You can create a new command that triggers based on specific conditions, such as a due date. Customize the frequency of the recurrence, choosing options like daily, weekly, or monthly. Once set up, Butler will automatically generate the tasks as specified, helping you manage ongoing responsibilities with ease.

Eventbrite is a user-friendly platform for managing events, whether you're planning a small gathering or a large conference. To get started, create an account and explore the site’s features, including event creation, ticketing options, and promotional tools. You can easily customize your event page with details like date, location, and pricing. Once your event is set up, share it across social media and track ticket sales through the dashboard. This guide will help you navigate Eventbrite effectively and maximize your event’s reach.
